
The MLM Insights dashboard provides a centralized view of network performance, sales activity, distributor earnings, and operational efficiency. It helps administrators monitor growth trends, evaluate member engagement, track financial distribution, and identify opportunities to improve retention and revenue.
Each section represents a key performance area of the MLM ecosystem, enabling informed decision-making through visual data summaries.
In order to view the MLM Insights, go to the left menu bar and select Insights.
Overview of MLM Insights
Total Commission
Displays the total commission generated by the network within the selected time period. This includes all earnings allocated to distributors from product sales and downline activity.
Total Profit
Represents the organization’s net profit after deducting commissions and related operational expenses from total revenue.
Number of Users
Shows the total number of registered members in the MLM network. The growth indicator reflects changes in network size over time.
Total Sales
Indicates the total value of product or package purchases made across the network during the selected period.

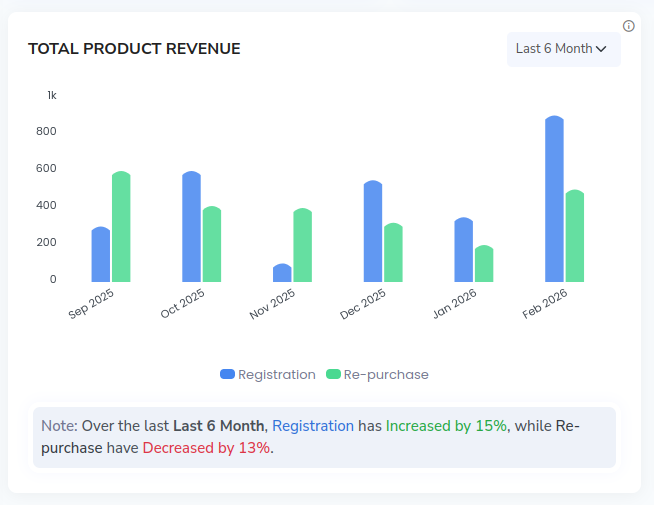
Total Product Revenue
Compares revenue generated from new registrations and repurchases. This section helps distinguish between customer acquisition and repeat purchasing behavior.
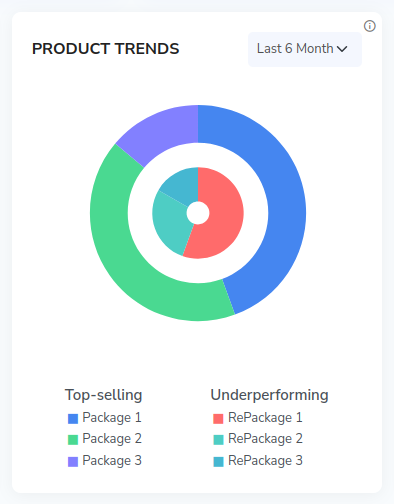
Product Trends
Displays the performance of different packages or products. It highlights top-selling items and underperforming offerings based on sales activity.
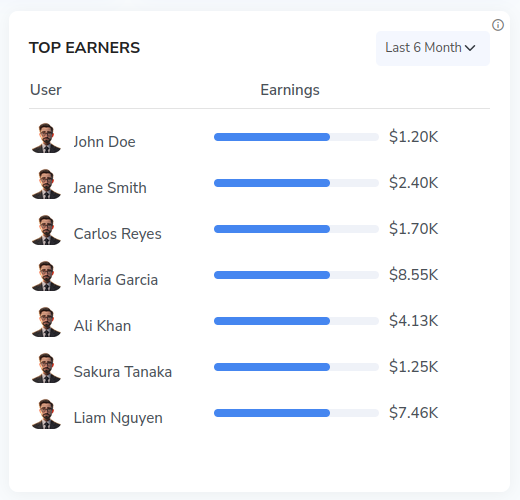
Top Earners
Lists members who generated the highest earnings within the selected timeframe. This reflects distributor performance and leadership impact within the network.
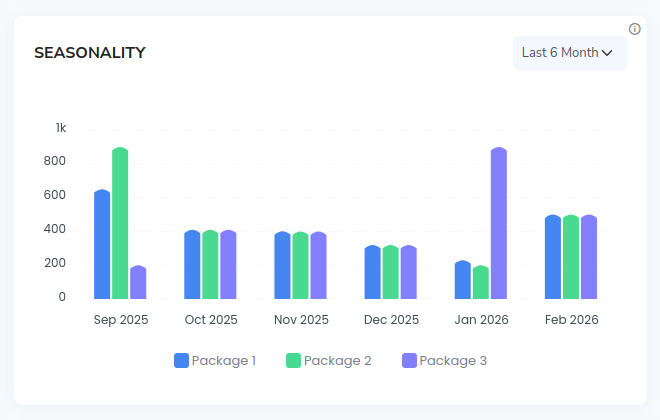
Seasonality
Shows how product sales vary across different months. This helps identify peak periods, demand cycles, and seasonal purchasing patterns.
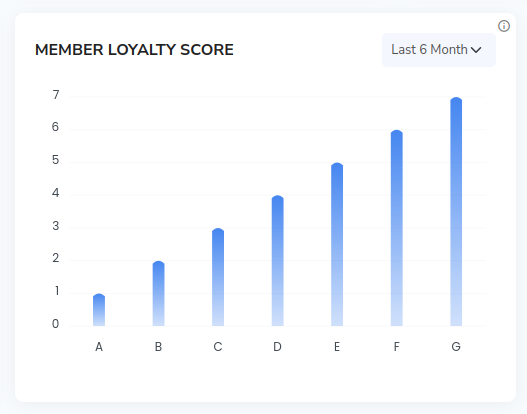
Member Loyalty Score
Measures member engagement based on activity level, purchases, and participation within the network. Higher scores indicate stronger commitment and retention.
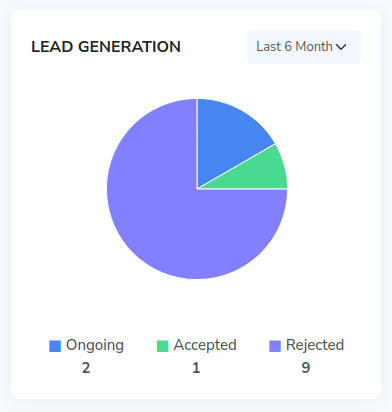
Lead Generation
Displays the status of leads in the recruitment or sales funnel.
- Ongoing → Leads currently in progress
- Accepted → Successfully converted leads
- Rejected → Leads that did not convert
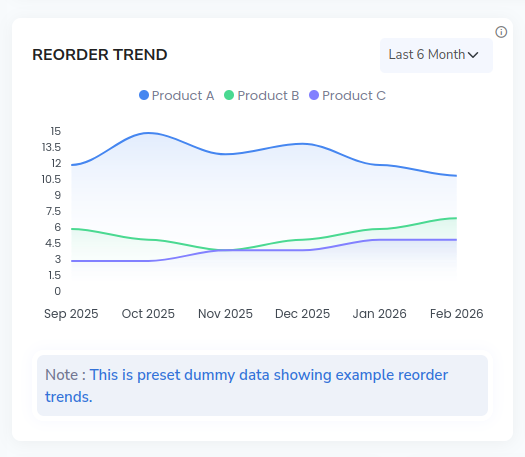
Reorder Trend
Tracks repeat purchase activity for selected products over time. This metric helps evaluate customer retention and product loyalty.
Support Tickets
Shows the distribution of support requests by status. It helps monitor service efficiency and the progress of issue resolution.

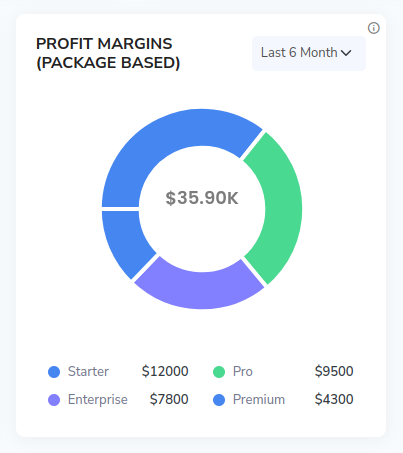
Profit Margins (Package Based)
Breaks down profit contribution by package type. This helps identify which offerings generate the highest financial returns.
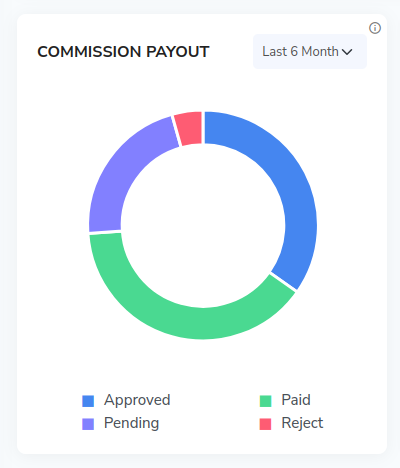
Commission Payout
Displays the current status of commission payments.
- Approved → Verified for payment
- Paid → Successfully distributed
- Pending → Awaiting processing
- Rejected → Not eligible for payment
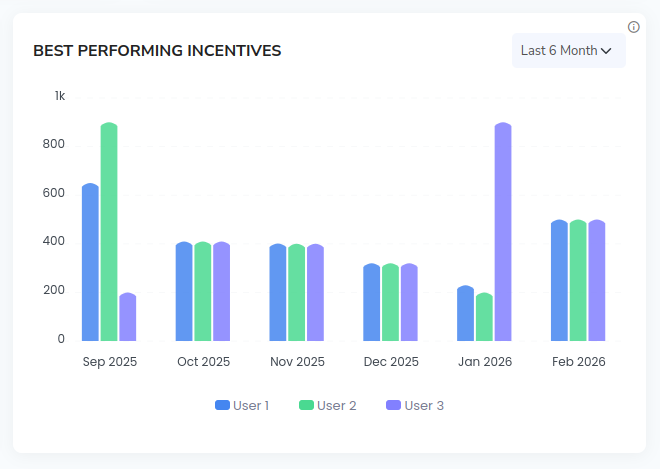
Best Performing Incentives
Shows which user generates the highest participation or earnings among members. This helps evaluate the effectiveness of reward strategies.
Note: All metrics and charts can be filtered by a selected time period (for example, Last 6 Months, Last 1 Year, or custom ranges). Changing the time filter updates every section to reflect data only for the chosen duration.